
Average Electricity Bill in Australia (2026): What You're Really Paying, State by State
Standing offer electricity bills range from $2,187 in Tasmania to $3,357 in South Australia in 2026–27, once every state is compared on the same usage level. This guide breaks down why the gap is so wide and what your own bill should actually be compared against.

On this page
Because electricity is regulated by state, and each regulator uses a different assumed usage level, there is no single official "average electricity bill" figure for Australia.
On top of that, network costs vary by distribution zone even within the same state, making it hard to find a true average figure.
What does exist is a set of government-published reference prices, and when you standardise them to the same usage level, a clear national picture emerges.
On 6,500 kWh of annual usage, standing offer electricity bills across Australia in 2026–27 range from $2,187 in Tasmania to $3,357 in South Australia.
Quick facts
- Standardised to 6,500 kWh of annual usage, 2026–27 standing offer electricity bills range from $2,187 in Tasmania to $3,357 in South Australia.
- These are standing offer prices, which act as a regulated ceiling. Most Australian households are on a market offer instead, and typically pay less than the figures above.
- South Australia is the only state where the regulated flat rate price rose in 2026–27, up 1.4%. Every other DMO and VDO region fell.
- Household size does not map cleanly to bill size. Actual usage, driven by appliances, heating and cooling, and how many people are home during the day, matters more than headcount alone.
- WA and the NT sit outside the National Electricity Market and have no default market offer. WA electricity is set directly by the state government through Synergy.
Why there's no single national average
Every state-based regulator calculates its reference price using a different assumed annual usage.
The Australian Energy Regulator's Default Market Offer, which covers NSW, South East Queensland, and South Australia, uses usage assumptions ranging from 3,900 kWh (Sydney's Ausgrid zone) to 4,900 kWh (Endeavour Energy, Western Sydney).
Victoria's Essential Services Commission uses 4,000 kWh for its Victorian Default Offer.
The ACT's regulator, the Independent Competition and Regulatory Commission, takes the published rates from each state's regulator (AER, ESC, OTTER, QCA) and recalculates every jurisdiction's bill at a standard 6,500 kWh, which is the closest thing Australia has to an apples-to-apples national comparison.
Average electricity bill by state, 2026–27
The table below uses the ICRC's standardised 6,500 kWh comparison for every jurisdiction covered by the National Electricity Market.
Western Australia is not part of the NEM and is not included in the ICRC's figures, so the WA figure here is a separate calculation using Synergy's published residential tariff at the same usage level, not an official government "average bill" statistic.
| State/territory | Annual bill (6,500 kWh, standing offer, GST inclusive) |
|---|---|
| Tasmania | $2,187 |
| Victoria | $2,392 |
| South East Queensland | $2,623 |
| Australian Capital Territory | $2,640 |
| Western Australia | Approx. $2,597 (calculated) |
| Regional Queensland | $2,671 |
| New South Wales | $2,869 |
| South Australia | $3,357 |
South Australia has the highest standing offer bill in the country on this measure, and it's also the only jurisdiction where the flat rate price rose year on year, up 1.4% under the AER's 2026–27 determination.
Tasmania has the lowest, reflecting its access to hydroelectric generation and comparatively low wholesale costs.
Every figure in this table is a standing offer price, meaning it's the maximum a retailer can charge a customer who hasn't chosen a market plan.
Across the DMO regions (NSW, SE Queensland, SA), only around 8% of households remain on a standing offer, and market offers generally sit below these figures.
New South Wales itself contains three separate distribution zones, and the $2,869 figure above is a state-wide weighted average.
Sydney's Ausgrid zone, Western Sydney's Endeavour Energy zone, and regional NSW's Essential Energy zone each have their own published rates, and Ausgrid's is lower than the state average shown here, largely because Ausgrid's own usage assumption (3,900 kWh) is lower than the standardised 6,500 kWh used in this national comparison.
What makes up an Australian electricity bill
Regardless of state, every electricity bill is built from the same four cost components, though the proportions shift depending on the network and the wholesale conditions in that region.
- Wholesale costs, the cost of buying electricity on the National Electricity Market, typically make up 30% to 41% of a bill in the DMO regions.
- Network costs, the cost of poles, wires, and substations, are usually the largest single component, ranging from 39% to 54%.
- Environmental costs, covering government renewable energy schemes, sit at 2% to 3%.
- Retail costs, covering the cost to acquire, bill, and service customers, range from 7% to 16%.
Network costs are the reason two states with similar wholesale exposure can end up with very different bills. The ACT's 2026–27 pricing decision found network costs contributed 15% growth to its regulated price this year, more than any other single factor.
Average electricity bill by household size
The government-published guide to electricity usage by household-size was last updated in 2020, so any usage comparison on household size may not be as accurate as you would think.
The figures come from a benchmarking program the AER ran under the National Energy Retail Rules. It published electricity usage benchmarks by household size and climate zone at least every three years, and required retailers to print a comparison against these benchmarks directly on residential bills.
That update was published in December 2020, based on metered usage data collected in 2019 and a household survey run in mid-2020.
In August 2023, the Australian Energy Market Commission removed the AER's obligation to keep updating these benchmarks, and the requirement for retailers to display them on bills was scrapped from 30 September 2023.
In its own submission supporting that change, the AER confirmed it would keep using the 2020 figures "until data more tailored to the consumer's usage is available."
No update has followed. If your own bill shows a household-size comparison sourced to the AER, this 2020 dataset is almost certainly what's behind it, whether or not the bill itself says so.
That means the numbers predate the recent surge in home solar and battery uptake, the growth in electric vehicles, and the shift toward more people working from home full-time. Usage patterns behind these figures reflect 2019, not 2026.
With that in mind, here is what the AER's 2020 benchmark report shows as typical annual usage by household size for urban Sydney and Adelaide (Climate Zone 5):
| Climate zone (example city) | 1 person | 2 people | 3 people | 4 people | 5+ people |
|---|---|---|---|---|---|
| Tropical (Cairns, Townsville) | 3,759 | 5,933 | 6,376 | 9,019 | 9,715 |
| Subtropical (Brisbane) | 3,412 | 5,126 | 6,169 | 7,682 | 8,803 |
| Hot dry inland (Dubbo) | 3,890 | 6,161 | 9,295 | 9,295 | 9,295 |
| Warm temperate (Sydney, urban Adelaide) | 3,109 | 5,237 | 6,361 | 7,311 | 9,008 |
| Mild temperate (Melbourne) | 2,953 | 4,840 | 5,077 | 5,805 | 7,351 |
| Cool temperate (Canberra) | 4,360 | 6,107 | 7,722 | 9,542 | 10,150 |
| Cool temperate (Hobart) | 6,003 | 8,784 | 9,475 | 10,820 | 11,555 |
Figures are annual usage in kWh, 2020 benchmark. In the hot dry inland zone, the underlying report pooled 3, 4, and 5+ person households into a single figure due to small sample sizes in that region, which is why those three columns are identical for Dubbo.
Hobart stands out as the highest-usage city in the country on this measure, despite Tasmania's overall electricity bills sitting at the low end of the national comparison earlier in this guide.
That's the difference between usage and price: Tasmanian households tend to use more electricity for heating through long, cold winters, but pay a lower rate for it than most of the country, so the two effects partly offset each other.
Melbourne shows the opposite pattern, with the lowest usage of any city here, which reflects Victoria's historically high rate of gas heating taking load off the electricity grid.
These are usage figures, not dollar figures. Applying a current tariff to old usage data gives you a rough estimate at best. To get an approximate current-dollar figure, you'd multiply the relevant usage level by today's per-kWh rate for your own distribution zone.
Household size on its own is also a weak predictor regardless of the data's age. A single person working from home with the air conditioning running through summer can use as much electricity as a family of four who are out most of the day.
The more reliable approach for your own household is to check your bill's actual kWh usage against the current DMO or state regulator's usage assumption for your zone, rather than relying on a per-person estimate from any source.
Why bills changed in 2026–27
Most of the country saw electricity prices fall this year. The AER's Default Market Offer fell in every DMO region except South Australia, driven by lower wholesale electricity costs, reduced spot price volatility in the National Electricity Market since mid-2025, and lower environmental scheme costs following reductions to the Australian Government's renewable energy targets.
Victoria's Default Offer fell 5% for domestic customers, according to the Essential Services Commission's final decision, driven by lower environmental, wholesale, and network costs.
The ACT moved in the opposite direction. The ICRC reported a 2.7% rise there, due to higher network costs and a large increase in ACT Government renewable scheme costs, even though wholesale costs fell there too.
South Australia saw a similar pattern, with a 1.4% rise in its flat rate DMO despite falling costs elsewhere in the stack, because network and retail cost increases outweighed the wholesale savings.
How to lower your electricity bill
Because standing offer prices are a regulated ceiling rather than a market rate, the single biggest lever for most households is checking whether they're actually on a standing offer or a market offer, and comparing what's available against their usage rather than a generic average.
A few things worth checking before comparing plans:
- Whether you have a smart meter, which opens up time of use tariffs and the new Solar Sharer Offer in NSW, SE Queensland, and SA.
- Whether your current plan has conditional discounts tied to paying on time or by direct debit, since these can make a headline rate misleading.
- Whether you're eligible for state government concessions or rebates, which apply on top of whatever retail plan you choose.
Utility Club is here to help you discover how your current bill stacks up against what's available in the market right now. Start comparing today.
Photo by Anthony Indraus on Unsplash
See if you can save
Enter your address and compare plans from Australia's leading retailers.
Frequently asked questions
What is the average electricity bill in Australia?
Why do electricity bills vary so much between states?
Is the Default Market Offer the same as the average bill?
How much electricity does the average household use?
Did electricity prices go up or down in 2026–27?
Why is Western Australia not included in the national comparison?
Keep reading
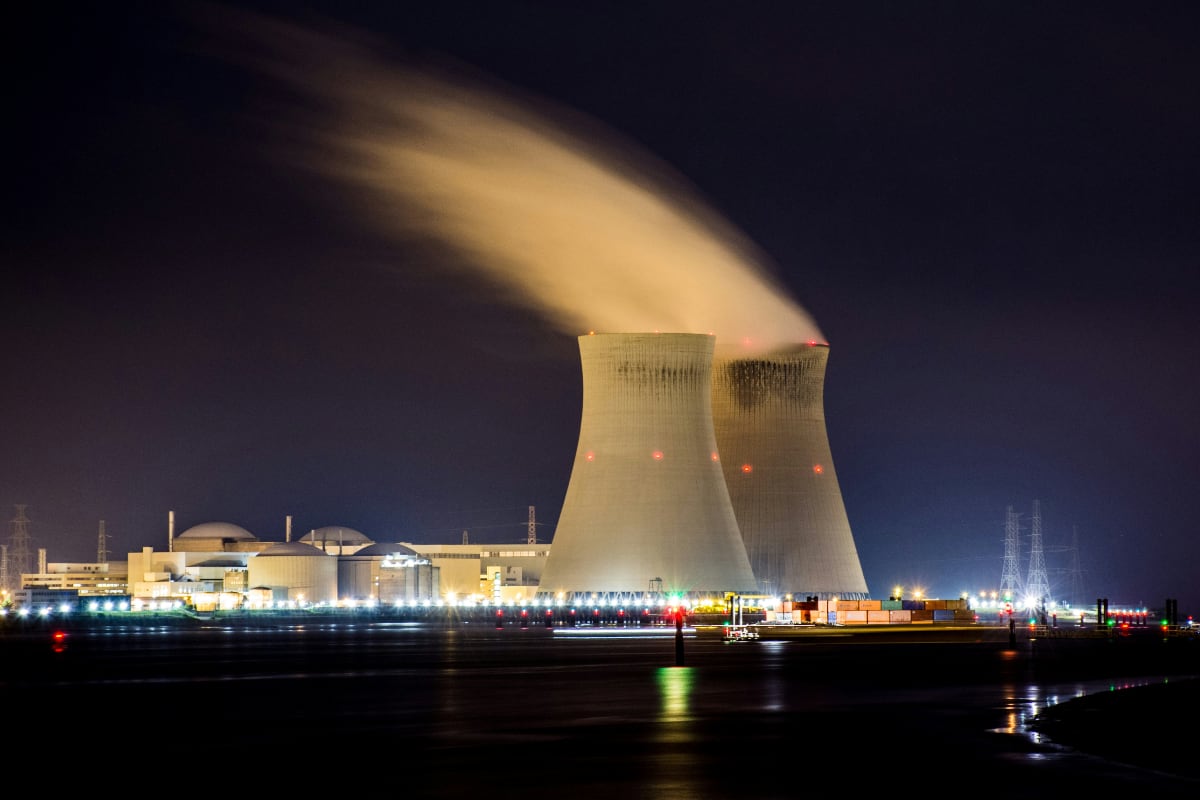
Virtual Power Plants (VPP) explained: How they work in Australia
A virtual power plant connects home batteries so they act like one power station. We explain how VPPs work in Australia, what they pay, what support applies and what to check before you sign.
What Is an NMI number? How to find yours in Australia
Your NMI is the unique number that identifies your electricity connection in Australia. Here's what it means, where to actually find it, and why it's different from your meter's serial number.
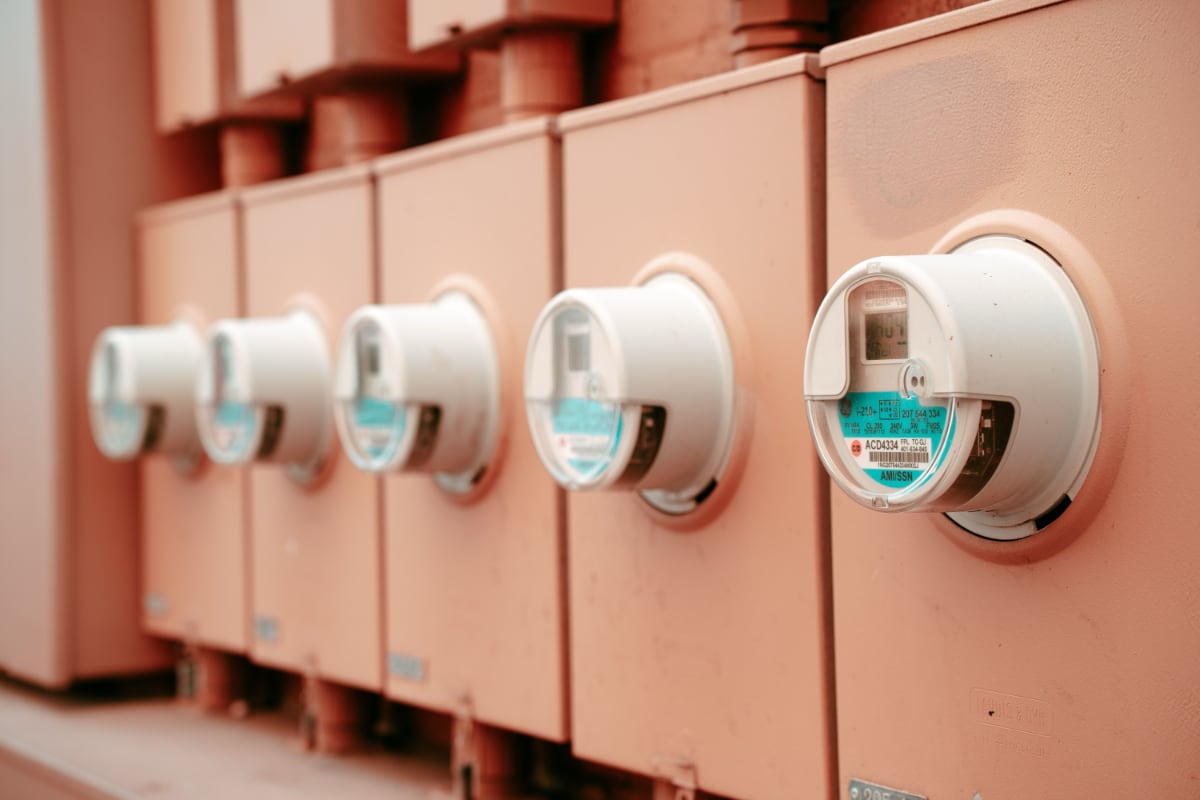
Smart meters in Australia: How they work, what they cost, and the mandatory rollout explained
Australia's smart meter rollout is now compulsory in most states. Here's what a smart meter does, why you can no longer opt out, what it costs, and how the two-year tariff protection works.